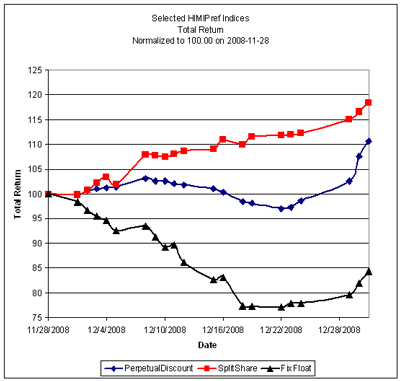
Trading was frenzied in December as a hesitant rally in PerpetualDiscounts was swamped by a wave of tax-loss selling and then skyrocketted after the selling pressure lifted. Meanwhile, SplitShares enjoyed a sharp recovery from their November trough and BCE issues (which comprised the whole of the FixFloat index until the month-end rebalancing) reacted very badly to news of the failure of the BCE / Teachers’ Deal:

Trades were, as ever, triggered by a desire to exploit transient mispricing in the preferred share market (which may the thought of as “selling liquidity”), rather than any particular view being taken on market direction, sectoral performance or credit anticipation.
| MAPF Sectoral Analysis 2008-12-31 | |||
| HIMI Indices Sector | Weighting | YTW | ModDur |
| Ratchet | 0% | N/A | N/A |
| FixFloat | 9.2% (+9.2) | 8.50% | 12.22 |
| Floater | 0% | N/A | N/A |
| OpRet | 0% | N/A | N/A |
| SplitShare (normal) |
12.3% (-21.1) | 17.01% | 5.55 |
| SplitShare (tendered) |
20.7% (+20.7) | 9.52% | 3.79 |
| Interest Rearing | 0% | N/A | N/A |
| PerpetualPremium | 0.0% (0) | N/A | N/A |
| PerpetualDiscount | 58.6% (-7.9) | 7.49% | 12.00 |
| Scraps | 0% | N/A | N/A |
| Cash | -0.8% (-0.9) | 0.00% | 0.00 |
| Total | 100% | 9.24% | 9.62 |
| Totals and changes will not add precisely due to rounding. Bracketted figures represent change from October month-end. Cash is included in totals with duration and yield both equal to zero. | |||
The “total” reflects the un-leveraged total portfolio (i.e., cash is included in the portfolio calculations and is deemed to have a duration and yield of 0.00.). MAPF will often have relatively large cash balances, both credit and debit, to facilitate trading. Figures presented in the table have been rounded to the indicated precision.
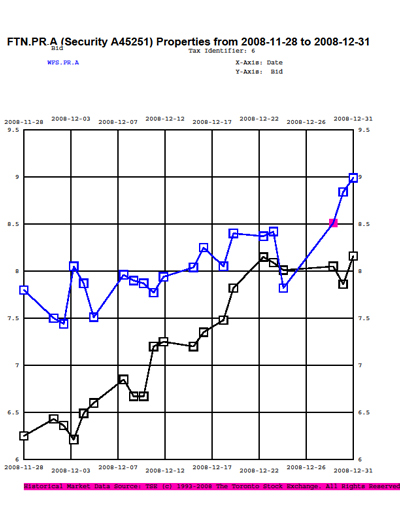
Positions held in WFS.PR.A and FTN.PR.A were tendered for their monthly retraction on their final dates (as per the fund’s sub-custodian): Dec 18 & Dec 11, respectively. I expect these retractions to be profitable, but not as profitable as they seemed at the time, since the market closed much of the gap between the trading price and the estimated retraction price between the tender date and the retraction dates of December 31:
Still, that’s the price you pay for caution! My very rough estimate of the retraction prices are $9.60 for WFS.PR.A and $8.32 for FTN.PR.A, but much depends on what price the issuer paid for the capital units required to make matched pairs.
Many readers will be more interested in the fixed-floater position: BCE.PR.I was purchased in two pieces on December 22 and December 23, following news that the normal course issuer bid would be restricted to 5% of outstanding common (which gives some comfort that the company will remain investment grade) and the DBRS pronouncement that Bell Canada (the operating subsidiary) is under credit review positive. These pieces of reassurance and the continued collapse of the share price (see chart above for fixed-floater total return) tipped the scales.
| Post-Mortem on BCE.PR.I Purchase | ||||
| Date | BCE.PR.I | SLF.PR.E | BMO.PR.K | NA.PR.L |
| Nov. 28 | 17.00 | 13.60 | 16.75 | 15.00 |
| Dec. 22 | Bought 13.00 |
Sold 12.50 |
||
| Dec 23 | Bought 13.03 |
Sold 15.50 |
Sold 14.36 |
Closing Bid Dec 31 |
13.50 | 15.18 | 18.51 | 15.58 |
| Dividend Effects |
Earned $0.29 |
None | None | None |
I mourn the absence of the PerpetualDiscounts which were swapped into the BCE.PR.I, but that’s life! I will note that on January 2, BCE.PR.I closed with a bid of $14.71 having traded as high as $15.49 on the day … so I won’t throw away the valuation model just yet! I will note that these trades have decreased the mis-match between the fund and the index.
Credit distribution is:
| MAPF Credit Analysis 2008-12-31 | |
| DBRS Rating | Weighting |
| Pfd-1 | 56.1% (-0.6) |
| Pfd-1(low) | 3.1% (-7.4) |
| Pfd-2(high) | 0% (0) |
| Pfd-2 (held) |
2.0% (+1.6) |
| Pfd-2 (tendered for retraction) |
9.3% (+9.3) |
| Pfd-2(low) (held) |
19.0% (-13.3) |
| Pfd-2(low) (tendered for retraction) |
11.4% (+11.4) |
| Cash | -0.8% (-0.9) |
| Totals will not add precisely due to rounding. Bracketted figures represent change from November month-end. | |
The fund does not set any targets for overall credit quality; trades are executed one by one. Variances in overall credit will be constant as opportunistic trades are executed. The overall credit quality of the portfolio is now roughly equal to the credit quality of CPD at August month-end.
The lowest rated issues in the portfolio are the previously discussed BCE.PR.I and BNA.PR.C. The latter issue is an entirely reasonable credit; a split share secured by shares of BAM.A with asset coverage of about 1.8:1. In fact, the fund topped up its holdings of BNA.PR.C in December … the price has continued weak, but the yield of approximately 19% is very hard to resist! I will note that given a price of $9.00 for BNA.PR.C the asset coverage of the market price is approximately 5:1 … so I consider the investment well secured!
Liquidity Distribution is:
| MAPF Liquidity Analysis 2008-12-31 | |
| Average Daily Trading | Weighting |
| <$50,000 | 0.6% (-10.5) |
| $50,000 – $100,000 (held) |
1.2% (-31.0) |
| $50,000 – $100,000 (tendered for retraction) |
9.3% (+9.3) |
| $100,000 – $200,000 (held) |
31.2% (+30.2) |
| $100,000 – $200,000 (tendered for retraction) |
11.4% (+11.4) |
| $200,000 – $300,000 | 30.3% (+10.0) |
| >$300,000 | 16.9% (-15.3) |
| Cash | -0.8% (-0.9) |
| Totals will not add precisely due to rounding. Bracketted figures represent change from November month-end. | |
MAPF is, of course, Malachite Aggressive Preferred Fund, a “unit trust” managed by Hymas Investment Management Inc. Further information and links to performance, audited financials and subscription information are available the fund’s web page. A “unit trust” is like a regular mutual fund, but is sold by offering memorandum rather than prospectus. This is cheaper, but means subscription is restricted to “accredited investors” (as defined by the Ontario Securities Commission) and those who subscribe for $150,000+. Fund past performances are not a guarantee of future performance. You can lose money investing in MAPF or any other fund.
A similar portfolio composition analysis has been performed on The Claymore Preferred Share ETF (symbol CPD) as of August 29. When comparing CPD and MAPF:
- MAPF credit quality is similar
- MAPF liquidity is higher
- MAPF Yield is higher
- Weightings in
- PerpetualDiscounts is similar
- MAPF is less exposed to Fixed-Resets and Operating Retractibles
- MAPF is more exposed to SplitShares
- FixFloat / Floater / Ratchet is similar

[…] for the apparent stall in the increase of sustainable income per unit in the past seven months. In December 2008, FixedReset exposure was zero; it is now 11.3%. Exposure to the extraordinarily high-yielding SplitShare class has also been […]
[…] for the apparent stall in the increase of sustainable income per unit in the past seven months. In December 2008, FixedReset exposure was zero; it is now 16.8%. Exposure to the extraordinarily high-yielding SplitShare class has also been […]
[…] equivalent calculation for December 2008 is $8.0464 [NAVPU] * 0.0749 [Yield on PerpetualDiscounts] / 1.1883 [Capital Gains Multiplier] = 0.5072, which shows that progress is indeed being made! The […]