The Federal Reserve Bank of Boston has released Working Paper No. QAU10-4 by José L. Fillat and Judit Montoriol-Garriga titled Addressing the pro-cyclicality of capital requirements with a dynamic loan loss provision system:
The pro-cyclical effect of bank capital requirements has attracted much attention in the post-crisis discussion of how to make the financial system more stable. This paper investigates and calibrates a dynamic provision as an instrument for addressing pro-cyclicality. The model for the dynamic provision is adopted from the Spanish banking regulatory system. We argue that, had U.S. banks set aside general provisions in positive states of the economy, they would have been in a better position to absorb their portfolios’ loan losses during the recent financial turmoil. The allowances accumulated by means of the hypothetical dynamic provision during the cyclical upswing would have reduced by half the amount of TARP funds required. However, the cyclical buffer for the aggregate U.S. banking system would have been depleted by the first quarter of 2009, which suggests that the proposed provisioning model for expected losses might not entirely solve situations as severe as the one experienced in recent years.
This is a useful, if not particularly earth-shattering, paper. If the banks had held more reserves prior to the crisis, they would have had more reserves during the crisis. So?
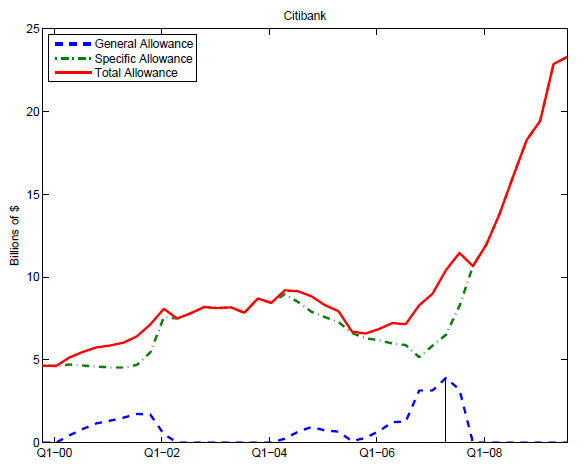
What I found interesting was the discussion of Citibank:
Figure 8, shows that Citibank would have depleted the newly created general allowance in the fourth quarter of 2007—much earlier than the rest of the institutions and earlier than the aggregate of the U.S. financial system. From that date on, Citibank would have been in the same situation as without the dynamic provision. That is, total provisions for loan losses would be equal to the specific allowance (ALLL) during the last 2 years, as observed. The results are driven by a relatively poor performance of the Citibank loan portfolio during the 2000 to 2005 period. During this period, the ratio of specific provisions to loans is above the banking system long-run average. Citibank would have started to build up the stock of reserves in 2006, too late to serve the purpose of attenuating the problems caused by increased loan losses in Citibank’s books with the recession.
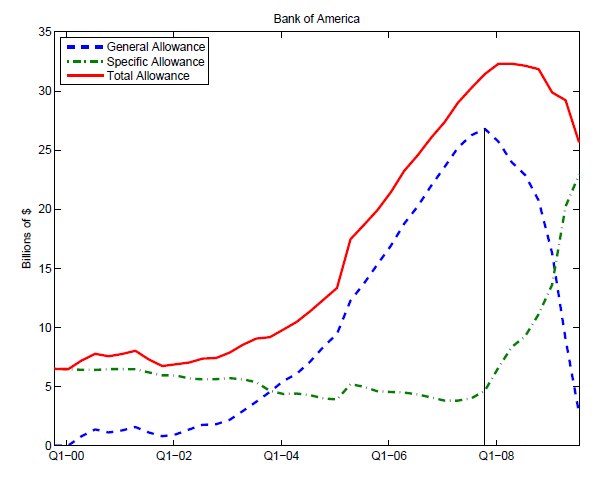
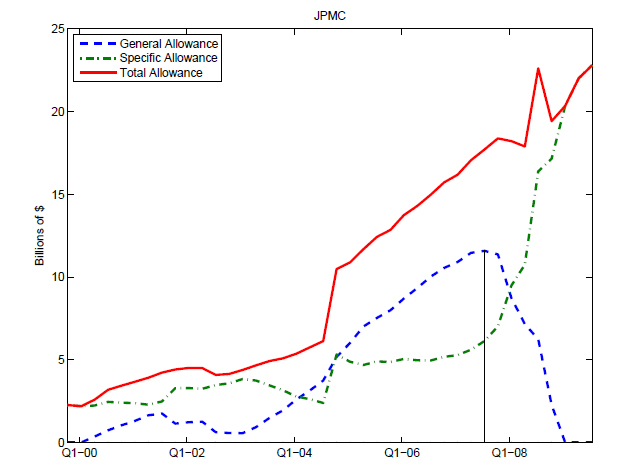
The figures below show the general allowance, the specific allowance and the total:
The dynamic provisioning system attempts to create an a-cyclical loan loss provision that reduces the chances of the amplification of an economic crisis through the banking sector. We follow the same approach and calibrate the parameters of the Spanish dynamic provision for the U.S. banking system using publicly available data. We show that if U.S. banks had funded provisions in expansion periods using this provisioning model, they would have been in a better position to absorb loan portfolio losses during the financial turmoil.
One thing that makes Dynamic Provisioning important is that it truly is a buffer. After all, if the minimum capital requirement is 4% and you have 5% … then your effective room isn’t really 5%, is it? If you fall below 4% the regulators will sieze your bank and either liquidate or sell it, so your room for mistakes is only 1%. This was the major problem during the crisis – not that capital would fall below 0% – insolvency – but that it would fall below 4% – regulatory siezure.
One thing I would like to see addressed in future papers on this topic is an analysis of how JPM and BAC would have reacted to the dynamic provisioning requirements estimated here. After all, the proposed rules are not truly countercyclical unless they actually reduce lending during boom times.


I always enjoy your constant update of the banking system, regulations and capital, and now it’s time to test my understanding of these figures:
Am I right in my interpretation that the Red lines for total provision represent capital set aside for FUTURE expected losses?
If so, then the set-aside was recognized in the income statement, GAAP EPS and regulatory capital calculations?
I’m trying to get at why US Corporate Profits to GDP (where economic profits are those reported to the government) are at a near-record again (and didn’t dip much during the credit crisis) whereas S&P-500 EPS collapsed and have only partially rebounded.
If I understand the provisioning situation these losses have not (yet) been reported to the IRS and won’t be until they are realized, so this may contribute to the discrepancy between national economic accounts and aggregate GAAP EPS.
IF, as and when the provisions are recognized, the national accounts should show a temporary DIP in corporate profitability.
However, if the provisions are reversed partially or otherwise (as may be happening in the Bank of America figure) then GAAP EPS should show a temporary RISE in corporate profitability.
Given that national account profits are $1 trillion and each of these large banks has something like $20 extra billion of provisions, the banking sector as a whole could have provisions of 10+% of corporate profits.
What is your outlook on whether these provisions will be reversed, added to in continuing substantial amounts or gradually realized away?
As a second topic, you said:
“… the major problem during the crisis [was] – not that capital would fall below 0% – insolvency – but that it would fall below 4% – regulatory siezure.” [resulting in a 1% margin of error]
which brings up the point about new Basel III rules. Have they effectively moved up the minimum capital from 4% to something else so that the same delta (e.g. 1% in your example) exists, but is now the difference between, say 6% and 5% — in which case the BUFFER would not have increased, but the THRESHOLD for seizure (or contingent capital conversion or other precipitous action) might have?
If so, how much is change in Threshold vs change in Buffer?
Keep up the fine work.
Am I right in my interpretation that the Red lines for total provision represent capital set aside for FUTURE expected losses?
The blue lines that go to zero are the dynamic provisions. The green lines are the current provisions, which are not even allowed to look ahead and are reported on the books of the firm. The red lines are the sum, which would be the ones the regulators would look at for capital purposes. From the paper:
So – without having studied the construction of the national accounts – I think it’s fair to say that if the economy rebounds, then some of the ALLL will be reversed (but are currently rising sharply for all three banks).
Have they effectively moved up the minimum capital from 4%
Not as far as I can tell. The new rules slightly increase the “siezure” level, but add a 2.5% buffer; there will, apparently, be differing levels of restrictions on use of capital within that buffer level so that (for instance) if you were in the top third of that buffer, you could not increase dividends or buy back stock; in the middle third, in addition, you must decrease (although not eliminate) dividends; in the bottom third no cash bonuses would be payable; or something like that.
So the buffer rule will, effectively, increase the margin of error.
Aside from the ALLL and the loan book, what about securities that fell in price, but were not sold? I realize treatments may differ for available for sale (marked to market for GAAP) and investments intended to be kept for maturity (kept at book value?)
Is that all in addition to these loan provisions? and do you have any sense of the relative size of loan book to investment provisions?
btw, the original Fillat-MG article included some economy-wide provisioning aggregates that are in the $150B + range depending on what one should use as a baseline for “extra” provisioning, so we are talking of potentially 20% of corporate profits.
Is that all in addition to these loan provisions? and do you have any sense of the relative size of loan book to investment provisions?
Yes. The regulators are making changes to the capital requirements for the trading book in addition to looking at dynamic provisioning.
In the Haldane speech I reported previously, he said:
so we are talking of potentially 20% of corporate profits.
Not necessarily. I don’t think these dynamic provisions will be reflected on the books of the firms, or recognized for tax or statistical purposes – I believe they will be regulatory numbers only, used for capital but nothing else.
[…] Readers with long memories will remember my post titled FRBB Looks at Dynamic Provisioning. The FRBB paper concluded, in part: We argue that, had U.S. banks set aside general provisions in […]