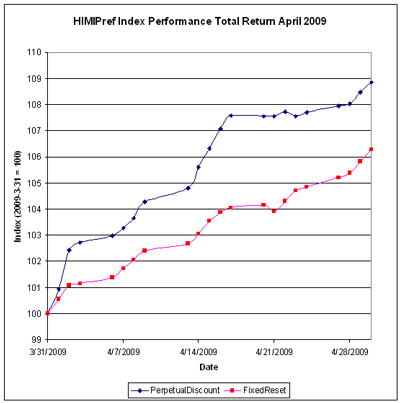
The fund performed well in a month that was as remarkable for its consistency as it was for the strong performance of the preferred share market. As noted in the report of Index Performance, April 2009, the PerpetualDiscount index experienced only three down-days in the month, compared to eighteen gainers:

The fund’s Net Asset Value per Unit as of the close April 30 was $9.8406.
| Returns to April 30, 2009 | |||
| Period | MAPF | Index | CPD according to Claymore |
| One Month | +11.42% | +6.37% | +6.97% |
| Three Months | +13.12% | +5.08% | +6.36% |
| One Year | +19.08% | -8.46% | -8.33% |
| Two Years (annualized) | +9.35% | -7.05% | |
| Three Years (annualized) | +8.44% | -3.44% | |
| Four Years (annualized) | +7.93% | -1.77% | |
| Five Years (annualized) | +8.29% | -0.31% | |
| Six Years (annualized) | +10.96% | +0.76% | |
| Seven Years (annualized) | +9.61% | +1.49% | |
| Eight Years (annualized) | +10.41% | +1.42% | |
| The Index is the BMO-CM “50” | |||
| CPD Returns are for the NAV and are after all fees and expenses. | |||
| Figures for Omega Preferred Equity (which are after all fees and expenses) for 1-, 3- and 12-months are +6.3%, +5.1% and -8.6%, respectively, according to Morningstar after all fees & expenses | |||
| Figures for Jov Leon Frazer Preferred Equity Fund (which are after all fees and expenses) for 1-, 3- and 12-months are N/A, N/A & N/A, respectively, according to Morningstar | |||
| Figures for AIC Preferred Income Fund (which are after all fees and expenses) for 1-, 3- and 12-months are N/A, N/A & N/A, respectively | |||
Returns assume reinvestment of dividends, and are shown after expenses but before fees. Past performance is not a guarantee of future performance. You can lose money investing in Malachite Aggressive Preferred Fund or any other fund. For more information, see the fund’s main page.
The yields available on high quality preferred shares remain elevated, which is reflected in the current estimate of sustainable income.
| Calculation of MAPF Sustainable Income Per Unit | |||||
| Month | NAVPU | Portfolio Average YTW |
Leverage Divisor |
Securities Average YTW |
Sustainable Income |
| June, 2007 | 9.3114 | 5.16% | 1.03 | 5.01% | 0.4665 |
| September | 9.1489 | 5.35% | 0.98 | 5.46% | 0.4995 |
| December, 2007 | 9.0070 | 5.53% | 0.942 | 5.87% | 0.5288 |
| March, 2008 | 8.8512 | 6.17% | 1.047 | 5.89% | 0.5216 |
| June | 8.3419 | 6.034% | 0.952 | 6.338% | $0.5287 |
| September | 8.1886 | 7.108% | 0.969 | 7.335% | $0.6006 |
| December, 2008 | 8.0464 | 9.24% | 1.008 | 9.166% | $0.7375 |
| March 2009 | $8.8317 | 8.60% | 0.995 | 8.802% | $0.7633 |
| April 2009 | 9.8406 | 7.82% | 0.994 | 7.867% | $0.7742 |
| NAVPU is shown after quarterly distributions. “Portfolio YTW” includes cash (or margin borrowing), with an assumed interest rate of 0.00% “Securities YTW” divides “Portfolio YTW” by the “Leverage Divisor” to show the average YTW on the securities held; this assumes that the cash is invested in (or raised from) all securities held, in proportion to their holdings. “Sustainable Income” is the resultant estimate of the fund’s dividend income per unit, before fees and expenses. |
|||||
As discussed in the post MAPF Portfolio Composition: April 2009, the fund has positions in splitShares (almost all BNA.PR.C) and an operating retractible (YPG.PR.B), both of which skew the calculation. Since the yield on thes positions is higher than that of the perpetuals despite the fact that the term is limited, the sustainability of the calculated “sustainable yield” is suspect, as discussed in August, 2008.
Significant positions were also held in Fixed-Reset issues on April 30 (HSB.PR.E, BMO.PR.O & CM.PR.M); all of which currently have their yields calculated with the presumption that they will be called by the issuers at par at the first possible opportunity.
However, if the entire portfolio except for the PerpetualDiscounts were to be sold and reinvested in these issues, the yield of the portfolio would be the 7.13% shown in the April 30 Portfolio Composition analysis (which is in excess of the 6.80% index yield on April 30). Given such reinvestment, the sustainable yield would be 9.8406 * 0.0713 = $0.7016, an increase from the $0.6712 derived by a similar calculation last month; which I consider rather good considering the increased allocation in April to the lower-yielding Fixed-Reset issues.
Different assumptions lead to different calculations, but the overall positive trend is apparent. I’m very pleased with the results! It will be noted that if there was no trading in the portfolio, one would expect the sustainable yield to be constant (before fees and expenses). The success of the fund’s trading is showing up in
- the very good performance against the index
- the long term increases in sustainable income per unit
As has been noted, the fund has maintained a credit quality equal to or better than the index; outperformance is due to constant exploitation of trading anomalies.
Again, there are no predictions for the future! The fund will continue to trade between issues in an attempt to exploit market gaps in liquidity, in an effort to outperform the index and keep the sustainable income per unit – however calculated! – growing.
[…] The figure shown would be the product of the current one-year return and the similar figure reported for April 2009; but this month’s figure has not yet been published by […]