Performance of the HIMIPref™ Indices for May, 2009, was:
| Total Return | ||
| Index | Performance |
Three Months to May 29, 2009 |
| Ratchet | +33.18% * | +55.96% * |
| FixFloat | +33.18% ** | +55.96% ** |
| Floater | +33.18% | +55.96% |
| OpRet | +1.35% | +5.84% |
| SplitShare | +3.50% | +11.15% |
| Interest | 0.0% | +2.57% |
| PerpetualPremium | +4.24%*** | +14.65%*** |
| PerpetualDiscount | +4.24% | +14.65%% |
| FixedReset | +2.05% | +10.55% |
| * The last member of the RatchetRate index was transferred to Scraps at the February, 2009, rebalancing; subsequent performance figures are set equal to the Floater index | ||
| ** The last member of the FixedFloater index was transferred to Scraps at the February, 2009, rebalancing. Performance figures to 2009-5-29 are set equal to the Floater index. The FixedFloater index acquired a member on 2009-5-29. | ||
| *** The last member of the PerpetualPremium index was transferred to PerpetualDiscount at the October, 2008, rebalancing; subsequent performance figures are set equal to the PerpetualDiscount index | ||
| Passive Funds (see below for calculations) | ||
| CPD | +3.99% | +11.90% |
| DPS.UN | +6.35% | +14.30% |
| Index | ||
| BMO-CM 50 | % | % |
There is still a negative total return over one year – even for Floaters, despite their astonishing rise in the past three months:
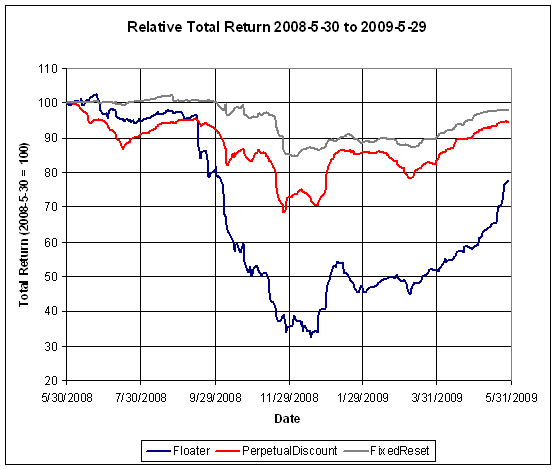
Click for big
Claymore has published NAV and distribution data for its exchange traded fund (CPD) and I have derived the following table:
| CPD Return, 1- & 3-month, to May 29, 2009 | ||||
| Date | NAV | Distribution | Return for Sub-Period | Monthly Return |
| February 27, 2009 | 14.40 | 0.00 | ||
| March 26 | 14.19 | 0.2100 | 0.00% | +0.63% |
| March 31, 2009 | 14.28 | +0.63% | ||
| April 30 | 15.27 | 0.00 | +6.93% | |
| May 29, 2009 | 15.88 | 0.00 | +3.99% | |
| Quarterly Return | +11.90% | |||
The DPS.UN NAV for May 27 has been published so we may calculate the May returns (approximately!) for this closed end fund.
| DPS.UN NAV Return, May-ish 2009 | |||
| Date | NAV | Distribution | Return for period |
| April 29, 2009 | 17.07 | ||
| May 27, 2009 | 18.18 | 0.00 | +6.50% |
| Estimated April Ending Stub** | +0.33% | ||
| Estimated May Ending Stub | +0.19% | ||
| Estimated May Return | +6.35% | ||
| ** CPD had a NAV of $15.22 on April 29 and a NAV of $15.27 on April 30. The return for the day was therefore +0.33%. This figure is subtracted from the DPS.UN period return to arrive at an estimate for the calendar month. | |||
| * CPD had a NAV of $15.85 on May 27 and a NAV of $15.88 on May 29. The return for the period was therefore +0.19%. This figure is added to the DPS.UN period return to arrive at an estimate for the calendar month. | |||
| The May return for DPS.UN’s NAV is therefore the product of three period returns, +6.50%, -0.33% and +0.19% to arrive at an estimate for the calendar month of +6.35% | |||
Now, to see the DPS.UN quarterly NAV approximate return, we refer to the calculations for March and April:
| DPS.UN NAV Returns, three-month-ish to end-May-ish, 2009 | |
| March-ish | -0.23% |
| April-ish | +7.72% |
| May-ish | +6.35% |
| Three-months-ish | +14.30% |
Nice thorough work James, but I think the first column in the first table should be labeled the May 2009 performance (not April).
Cheers
Oops! Sorry! Fixed!
[…] Trading activity increased slightly in May, with portfolio turnover of about 90%, as the market extended its gains. […]
[…] well in another month of recovery for the preferred share market. As noted in the report of Index Performance, May 2009, Floaters did extremely well in the month – although still an underperforming sector over the past […]
[…] Now, to see the DPS.UN quarterly NAV approximate return, we refer to the calculations for April and May: […]
[…] to see the DPS.UN quarterly NAV approximate return, we refer to the calculations for May and […]