Split Yield Corp has announced:
Split Yield Corporation (“Split Yield”) reports financial results for the six months ending July 31, 2009.
The six month period ending July 31, 2009 was one of the most tumultuous periods in financial market history. Against this backdrop, the market prices of the stocks in the portfolio mirrored this activity reaching lows in early March but recovering significantly by the end of July. The net asset value per unit (a unit consists of one Class I Preferred share, one Class II Preferred share and one Capital share) increased by $3.43 to $18.66 per unit as at July 31, 2009.
In a word, yech. As the audited financials state:
The Company has 1,213,202 Class I Preferred shares and 1,213,202 Class II Preferred shares outstanding as at July 31, 2009 with a principal repayment of $24,264,040 and $18,198,030 respective due on termination date, February 1, 2012. As at July 31, 2009 the Company had net assets equivalent to $18.66 per Class I Preferred share and nil per Class II Preferred share. This represents a deficiency as at July 31, 2009 of $1.34 per Class I Preferred share and $15.00 per Class II Preferred share for a total deficiency of $19,823,720. If this condition prevails, the Company will have insufficient assets to meet its full liability of the Preferred shares at the termination date.
How did things come to such a pass? Well … I don’t know. The chart of NAV:
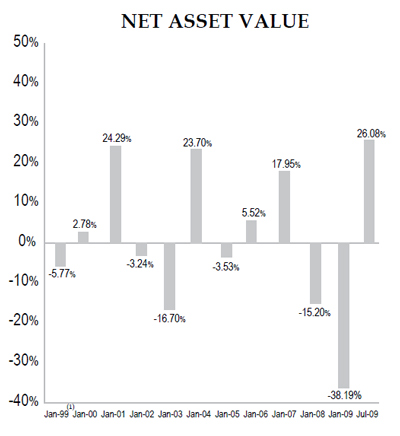
… shows some numbers for cumulative performance that, when a product is taken, come to a cumulative return since inception of -4.77%, and NAV has declined a lot more than that. I can only assume that this figure reports total return on the portfolio gross of distributions, in which case the decline in NAV is due to the cumulative distributions since inception of $7.25, $10.54 and $12.52 on the capital units, YLD.PR.B and YLD.PR.A, respectively. The MER (1.95% annualized in 1H09) will also have played a role.
The company notes:
The Company’s investment manager, Quadravest Capital Management Inc., actively manages the Company’s portfolio consisting primarily of common equities in the S&P/TSX 60 and the S&P 100 Indices. In order to generate additional income above the dividend and interest income earned in the Portfolio, the Company writes covered call options. This conservative strategy is designed to enhance the income in the portfolio by enabling the Company to earn strong income in times of volatile markets while reducing the effects of market corrections. In addition, this source of income is treated as capital gains and as such receives a more favorable tax treatment relative to other sources of income.
Quick! Does anybody have total return figures handy for those indices, from April 16, 1998 to July 31, 2009?
I estimate S&P TSX 60 rose from 452 to 654.56 over this period, for a 45% total return (3.3% annualized) IGNORING dividends (and MERs for the split share).
On the other hand, the OEX (S&P-100) FELL from 535.99 to 460.26 in US$ for a -14% return in US$ (-1.3% annualized) IGNORING dividends (which averaged about 2% — similar to the MER).
Unfortunately, the C$ rose from 0.702 (estimate) to 0.9269 over this period for a 32% total gain (2.5% annualized), so the C$ investor lost 35% (-3.7% annualized) on an index investment in OEX before dividends (and assuming the US positions were not currency hedged).
Since we don’t know the US/Canadian asset mix over time, we can only conclude that the loss on the split share NAV of 4% overall is between the TSX gain of 45% and the OEX/C$ loss of 35%.
This data also supports my strong contention that covered call writing DOES NOT add any income/value (if the options are fairly priced), and may very well be a NAV drag over time due to costs, bid-ask spread, and the possibility the calls are undervalued in the first place (so shorting them reduces profits vs buy and hold on the underlying stock). [I continue to be amazed that regulators continue to permit claims of potential income from covered call writing in prospectuses!]
Anyway, crap begets crap less MER, of course, so I’m not surprised that these prefs are dogs (and the CRAs gave them too high an original credit rating — DBRS pref rating downgrades are 20X more likely for split share prefs than ordinary corporation prefs — like most other structured products)
This data also supports my strong contention that covered call writing DOES NOT add any income/value (if the options are fairly priced),
Can you comment on the CBOE Covered Call Index?
I am familiar with the BXM. Your July 28 post, which I missed due to vacation, shows the basic features: lower volatility than the index, with lower returns on the upside and smaller losses on the downside.
I had a caveat “if the options are fairly priced”. The Ibbotson study cites a historical average of 16.5% implied volatility for the calls vs 14.9% realized by the index. Therefore, it is true that, for the historical period at least, the call options were 1.6% (16.5-14.9) or 10.7% (16.5/14.9 – 1) overpriced [in Black-Scholes the different volatilities work out to 9.7% overpriced for an at-the-money call, although this increases the more the call is out of the money and Black-Scholes is only an estimate; near out of the money calls have lower implied volatility due to the volatility smile].
Now consider the costs of trading. BXM requires 12 annual trades into a bid-ask (assuming cash settlements don’t trade). BXM data since 2003 has assumed options are sold at the mid-point of a bid-ask that is typically 8-10% of option price for the very liquid S&P-500 options. Ignoring commission, let’s say it costs 2-4% to trade this very active option contract (it would be more for individual stocks).
The average call option premium received historically has been 1.7% of the underlying index value (but this comes 12X per year), for a gross option income of 20.3% of underlying value per year. Of this, based on call options being overvalued by 10%, our expected gross profit is 2.03% annually, before costs, compared with a direct investment in the index.
However, annual costs of 2-4% of option premiums are 0.4 – 0.8% for the index, so the expected net profit after costs falls to 1.2-1.6% for the BXM strategy. While positive compared to the market, and indeed at lower risk than the index, this slim profit depends on some unique features of the S&P-500 index and BXM. Rampart BXM (an actual fund) may work very slightly, but actual stock portfolios owned by Split Share companies may experience different results.
One factor unique to the BXM and the S&P-500 option contract are that it is European settled for cash at expiry when in the money. Most individual stock options are American (can be excercised any time at or before expiry for delivery of the underlying stock). My experience has been that it is quite common for early exercise to occur just before ex-dividend dates, so somebody writing calls on individual stocks has replacement costs as well (bid-ask on the stock, market impact on the stock, bid-ask on the option).
Bid-Ask spreads on individual stock options are wider and liquidity is lower. Individual stocks have higher volatilities than indices, so option premiums are higher, but then so are bid-ask spreads as a proportion of underlying stock price.
There are lots of strike prices for the S&P-500 index, but many fewer for an individual stock. The more out of the money the call option relative to the stock price, the lower the implied volatility. My own evidence suggests that call strike prices higher than a few percent above the common price have implied volatilities BELOW the realized (the option is underpriced), although way above the strike price the implied volatility is much higher (speculative, but with little gross premium and super wide bid-ask).
Due to the volatility smile – the tendency for implied volatility vs strike price to minimize above but near the currrent stock price, writing covered calls is the least profitable of several option writing strategies (deeper index puts and higher index calls are overvalued systematically by 25% or more).
Finally, we have very little historical information about implied vs realized volatility for common stock options compared with index options. Index option writing is safer because of the European exercise, cash settlement and greater underlying diversity. It is possible that the less well studied stock option market could have higher potential profits due to higher volatility, a greater mismatch between implied and realized volatility, and market inefficiency but my personal experience is that it does not. A big factor has to be markedly higher trading cost.
It is important to remember, that even for BXM, the historical record shows that 90% of the gross premium covers the expected payout on the short call option — so the maximum profit is 10% of premiums before costs (2% annually). Canadian split share prospectuses are full of examples assuming the writers will retain 100% of the gross premiums (20+% annually), which is complete nonsense.
One day, in a perfect world, somebody will actually measure the performance of split share funds doing covered call writing. I bet it won’t be the sponsor — they like the marketing sex appeal of potential “value added” when it is just as likely they are value destroying. Furthermore, they don’t even get much benefit from risk reduction from call writing (the split share capital and pref shares are more volatile than market equivalents due to leverage and fluctuations in the discount/premium to NAV).
Indeed, capital share investors are purchasing an overvalued call option on the underlying portfolio (overvalued due to issue expenses and MER). If writing calls was a good idea then why are capital share investors buying a call?
[…] 2009-9-29: Assiduous Reader prefhound has commented on BXM on another […]
[…] YLD.PR.A and YLD.PR.B have both been tracked by HIMIPref™, but have been relegated to the Scraps index on credit concerns. Tracking of YLD.PR.B will cease immediately, but tracking of YLD.PR.A is expected to continue until redemption. YLD.PR.A and YLD.PR.B were last discussed on PrefBlog in connection with the 09H1 Financial Statements. […]